
Growth in New COVID-19 Cases (Australia)
The ability to see how new COVID-19 case numbers are trending is an important tool for authorities and healthcare workers, as well as those of us sitting at home thinking “Are these public health measures and restrictions actually having an impact?”
Current Wave Graph (Animation)
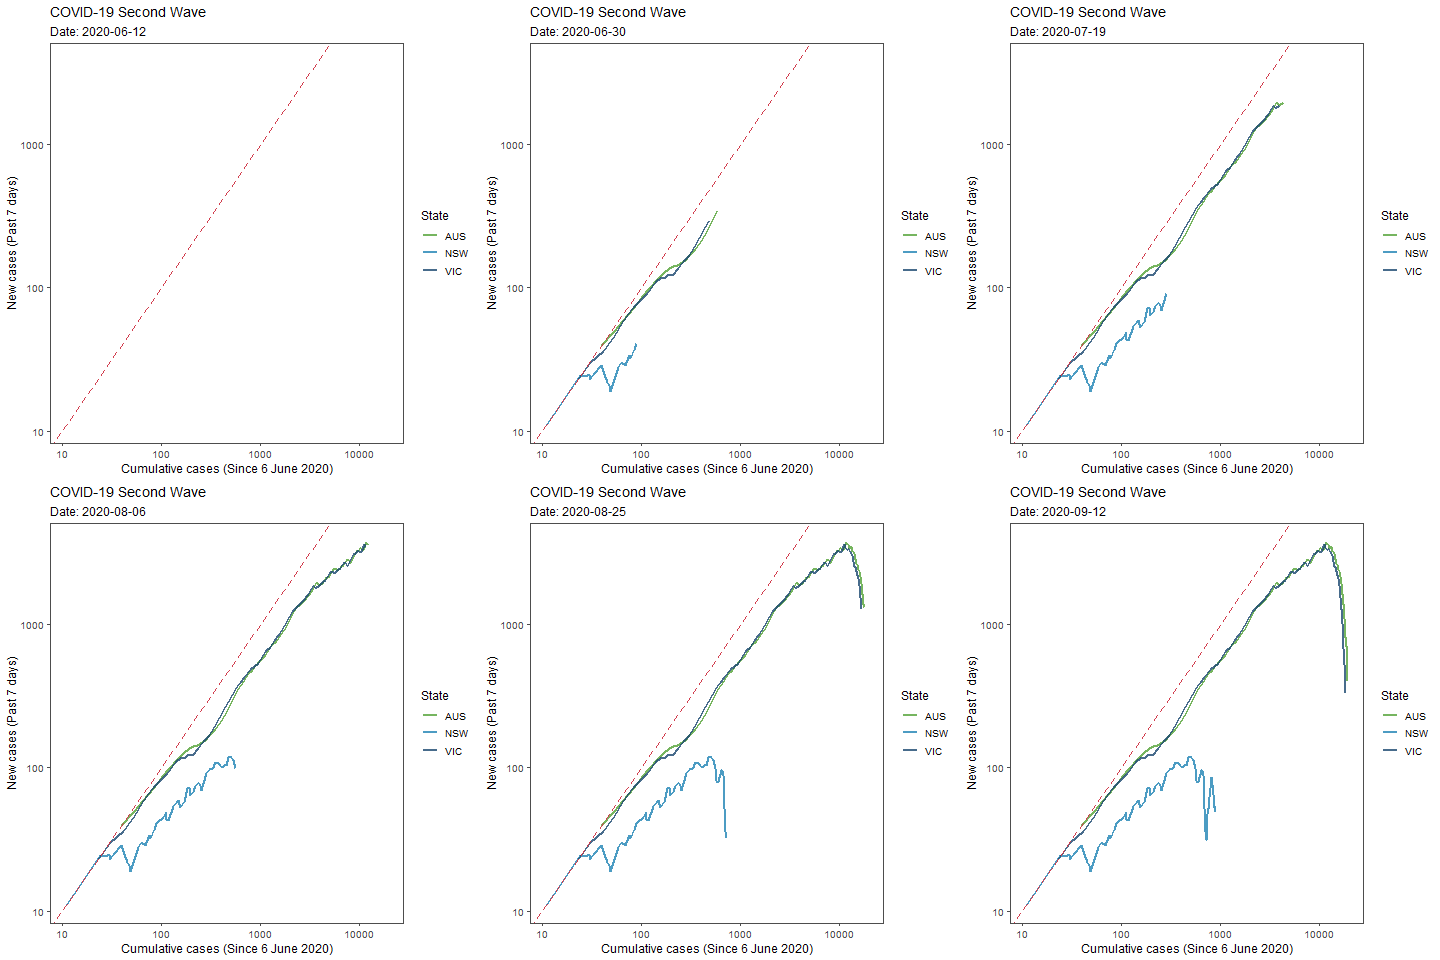
With exponential growth in COVID-19 cases, the number of new cases is proportional to the total number of infections. Thus the graph focuses on the rate at which new case numbers are increasing with respect to the total number of confirmed cases, rather than simply plotting new cases against time. Further, by using the logarithmic scale on both x- and y-axis, we can easily see whether we are getting a handle on the growth in new cases as the plotted line will drop away from the 45-degree line that represents uncontrolled exponential growth in case numbers.
Current Wave Graph (Static)
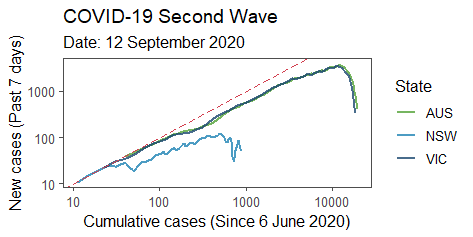
A key feature of the graph is the use of new case numbers from the past 7 days, rather than daily new case numbers, on the y-axis. This enables us to identify “real” trends in the data, particularly as testing capacity can vary throughout a week resulting in high variation in confirmed new cases.
Limitations
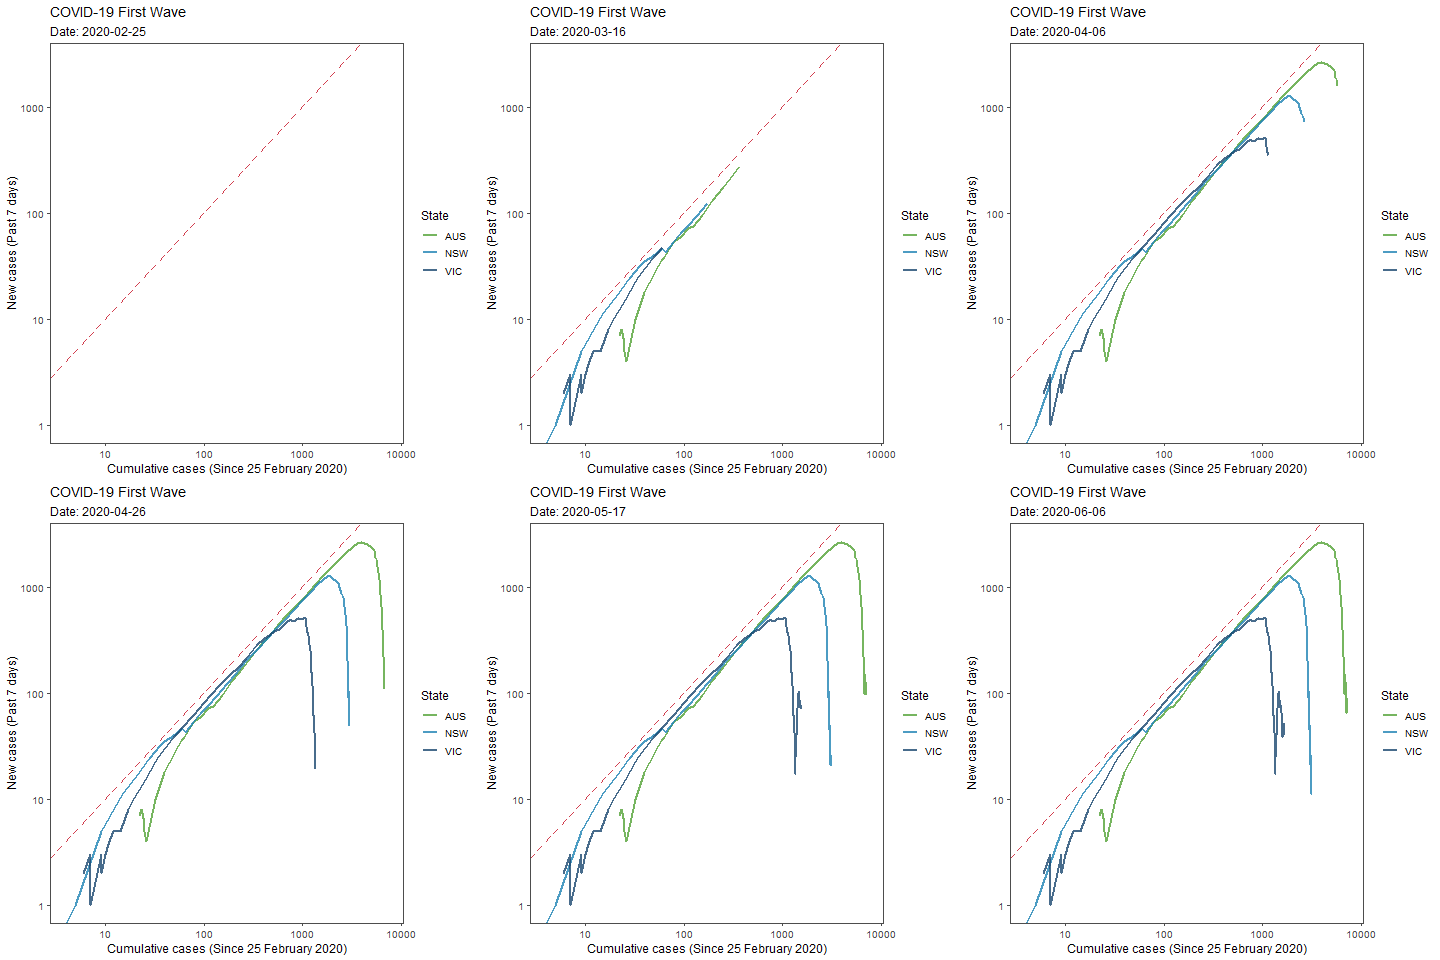
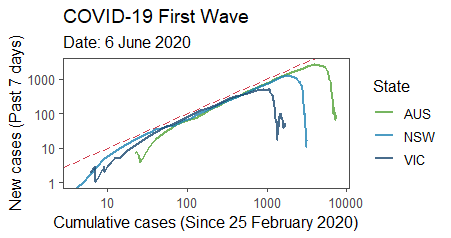
The graph is designed to highlight deviations of new case numbers from a rate of uncontrolled exponential growth. As such, it is not ideal when trying to look at case numbers across multiple waves. For this reason I have split graphs into “First” (cases from 25 Feb through to 6 Jun) and “Second” (cases since 6 Jun) wave graphs.
Further, due to the use of the log-scale across the x-axis, these graphs are not suited for identifying a resurgence of cases. A linear-scale on the x-axis would likely be more appropriate for this purpose.
First Wave Graph (Animation)
First Wave Graph (Static)
These graphs have been developed using R Studio. The methodology follows that of Aatish Bhatia and the team at MinutePhysics. Link